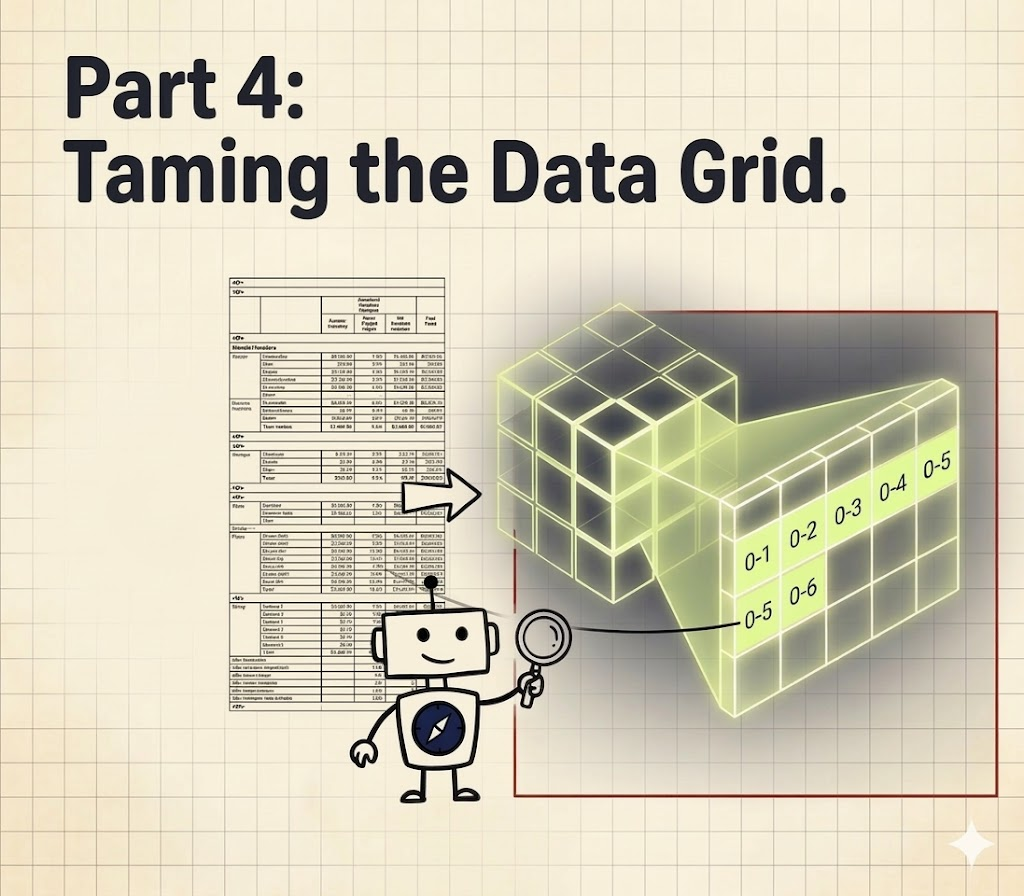
Taming the Data Grid
Welcome back, Developers..
You have conquered parse, split, extract and learned how to hunt down the data source using visual grounding. But deep in the docs lies a structure that breaks lesser tools: The Table.
Tables are not just text. They are distinct 2D grids where the relationship between "Row 3" and "Column 2" is just as important as the words themselves. If you treat a table like a flat string of text, you lose that relationship.
Fortunately, ADE doesn't just read tables—it reconstructs them.
1. The Anatomy of a chunkTable
When ADE encounters a table—whether in a PDF or a Spreadsheet—it wraps it in a special chunkTable.
Every table and each single cell inside a table has a unique id. These IDs are your coordinates. They tell you exactly where that cell came from.
Scenario A: The PDF Table (The Sequential Grid)
In PDFs and images, ADE assigns IDs based on the Page Number and a running counter.
Format: {page_number}-{sequential_number}
Example: 0-2 means "Page 0, Item 2".
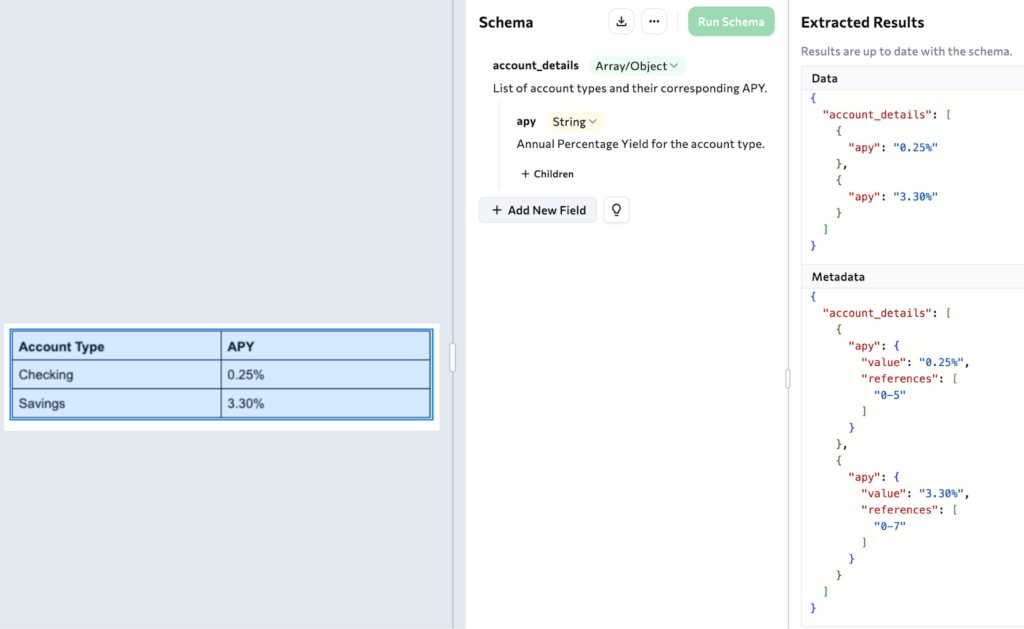
Let's look at a real-world example of a "Bank Account Rates" table parsed by ADE:
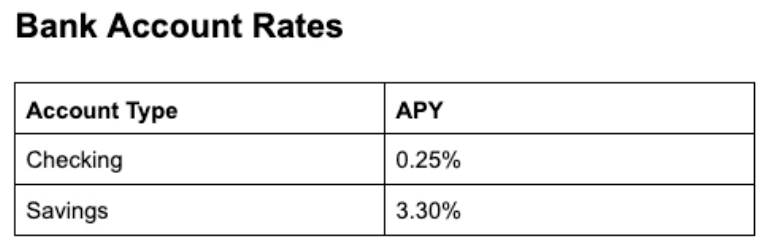
This is what the parsed .markdown looks like for this table image: tr for table rows, td for table data.
<a id='e529efbe-61dd-43a7-8cee-e6d03f88ef66'></a>
<table id="0-1">
  <tr><td id="0-2">Account Type</td><td id="0-3">APY</td></tr>
  <tr><td id="0-4">Checking</td><td id="0-5">0.25%</td></tr>
  <tr><td id="0-6">Savings</td><td id="0-7">3.30%</td></tr>
</table>
The table's structural hierarchy is elegantly mapped out across three nested layers within the JSON:
The Top-Level Container (e529efbe…): This represents the entire table block, including any surrounding context like titles or captions.
The Grid (0-1): This defines the precise boundary of the pure data grid itself.
The Cell Level (0-2 to 0-7): Refers to the exact cell for a single piece of data (like the "0.25%").
Navigating the Grounding Map
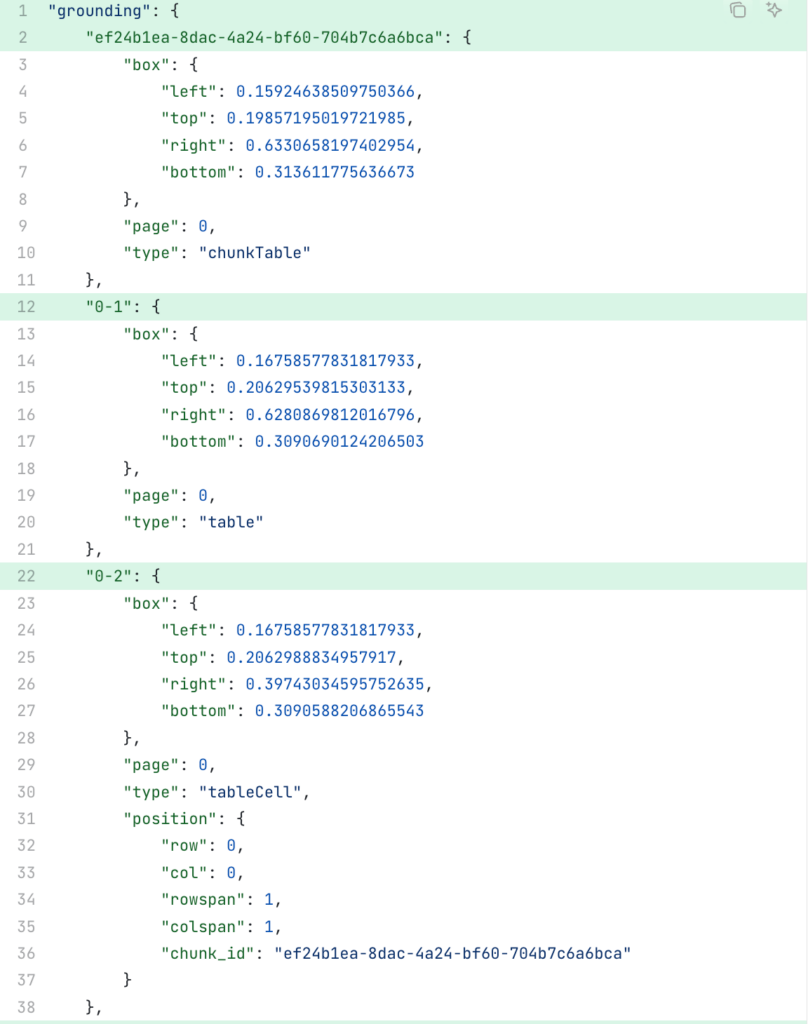
The "position" dictionary of a table cell tells you its precise address (Row 1, Column 1). It automatically handles merged data (colspan, rowspan) and importantly, uses "chunk_id" to link this tiny cell directly back to the massive parent container.
ADE handles merged cells natively using standard HTML attributes:
colspan="2": This cell stretches across 2 columns.
rowspan="3": This cell stretches down 3 rows.
Scenario B: The Spreadsheet Table (The Coordinate Grid)
When you parse an Excel or CSV file, ADE switches to "Spreadsheet Mode." It uses the actual tab names and cell references (A1, B2) for IDs.
Format: {tab_name}-{cell_reference}
Example: Sheet 1-B2
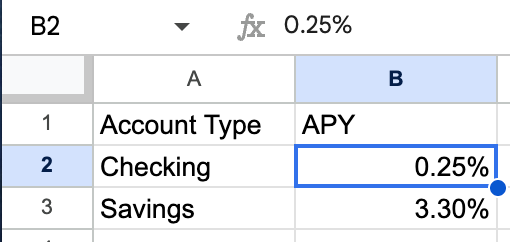
This is what the parsed .markdown looks like for this spreadsheet:
<table id='Sheet 1-A1:B3'>
  <tr>
    <td id='Sheet 1-A1'>Account Type</td>
    <td id='Sheet 1-B1'>APY</td>
  </tr>
  <tr>
    <td id='Sheet 1-A2'>Checking</td>
    <td id='Sheet 1-B2'>0.25%</td>
  </tr>
  <tr>
    <td id='Sheet 1-A3'>Savings</td>
    <td id='Sheet 1-B3'>3.30%</td>
  </tr>
</table>
2. Why does this matter? (The "Lookback" Power)
You might ask: "Why do I care about id='0-5'? I just want the number 0.25%."
You care because of Traceability.
Imagine you are building a financial auditing tool. ADE extracts from the table and tells you: "The APY is 0.25%."
Your colleague asks: "Where did you see that?"
Because the extraction references provide the ID (0-5), you can look up that ID in the Visual Grounding we learned in Part 3.
The Workflow: Content -> ID -> Location
Here is the correct mental model for processing tables:
Read the Extraction Result to find the value you want ("0.25%").
Grab the ID from that reference element (id="0-5").
Lookup the ID in the Grounding map to get the bounding box.
# 1. Extract tells us the value came from cell ID "0-5"
cell_id = "0-5"

# 2. We look up "0-5" in the visual grounding of parse output
location = parse_response.grounding[cell_id]

# 3. We get the EXACT coordinates on the original PDF
print(f"Row: {location.row}")      # e.g., 2
print(f"Col: {location.col}")      # e.g., 2
print(f"Box: {location.box}")      # {top: 0.45, left: 0.33...}
This allows you to draw a red box around the specific cell "0.25%" on the original PDF, proving to your user that the data is real.
Victory!
You have navigated the Tables!!
HTML Structure: You learned that tables are returned as HTML to preserve their grid layout.
The ID System: You saw how {page}-{seq} and {sheet}-{cell} IDs give you perfect traceability.
Complex Cells: You learned that rowspan and colspan are handled automatically.
Coming Up in Part 5:
"Boosting with Confidence," we will learn how to use the parse confidence score to create a Human-in-the-Loop (HITL) review process.