Credit Usage Cost Comparison on Four Use Cases - Gen1 vs Gen2

We ran four real sets of documents through Parse and Extract with the new v2 APIs and compared credit usage versus v1 apples-to-apples. The aggregate cost dropped 45% on identical work. This post shows where that reduction comes from and how Agentic Document Extraction pricing works in Gen2 with the v2 APIs.
Every number cited here is published in full, with the code, the documents, and the raw credit data, in our ADE sample projects repo. Each use case below links to its walkthrough.
This is a credits-to-credits comparison, and we are not converting to dollars. In this comparison we used the Standard service tier for the v2 APIs with the DPT-3 Pro model. We have since introduced DPT-3 Verity, a lower-cost model for digitally created text, which reduces cost further on pages of that kind. Note that the document samples are small, so treat the numbers as directional.
The four use cases
We picked four document types that demonstrate the versatility of Agentic Document Extraction and show how document processing cost shifts with page density, from a sparse one-page certificate to a dense, multi-page invoice. Every document, schema, and credit result is public in the ADE sample projects repo; each link below opens that use case's walkthrough.
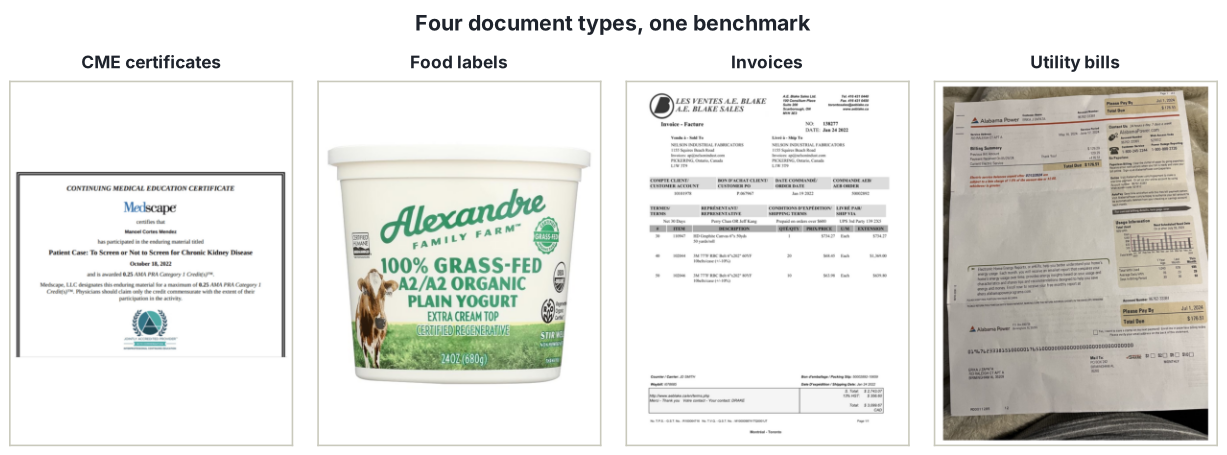
- Continuing education certificates: continuing-education completion certificates. Sparse, single-page, eight flat fields.
- Food labels: packaged-food nutrition and ingredient panels. Dense small text, 27 flat fields.
- Utility bills: residential electricity bills. One to four pages, five grouped charge objects.
- Invoices: vendor invoices with line-item tables. One to four pages, mixed layouts.
The numbers
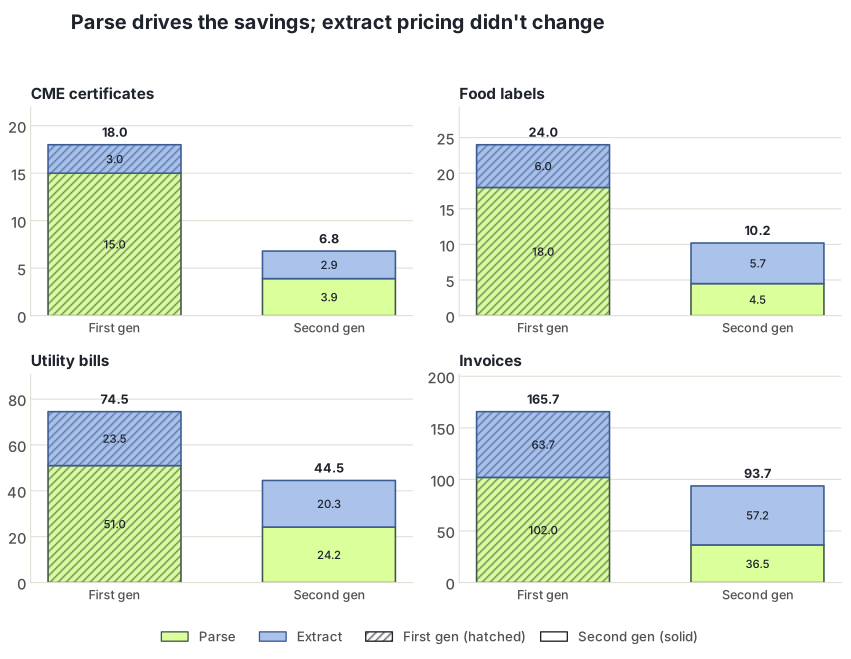
Credits per corpus, Gen1 to Gen2, split into the Parse and Extract steps:
| Use case | Parse credits | Extract credits | Total credits |
|---|---|---|---|
| Continuing education certificates | 15.0 → 3.9 (−74%) | 3.0 → 2.9 (−3%) | 18.1 → 6.8 (−62%) |
| Food labels | 18.0 → 4.5 (−75%) | 6.0 → 5.7 (−5%) | 24.0 → 10.2 (−58%) |
| Utility bills | 51.0 → 24.2 (−53%) | 23.5 → 20.3 (−14%) | 74.5 → 44.5 (−40%) |
| Invoices | 102.0 → 36.5 (−64%) | 63.7 → 57.2 (−10%) | 165.7 → 93.7 (−43%) |
| All four | 282.3 → 155.2 (−45%) |
Two patterns jump out.
- Observation 1: Almost all of the reduction comes from Parse.
- Observation 2: The savings are larger on sparse pages than on dense pages.
These observations are both consistent with intentional pricing philosophy changes.
How Agentic Document Extraction pricing works in Gen2
The two steps, Parse and Extract, are billed separately, and each is transparent enough to compute by hand. Parse is now complexity-aware. Gen1 charged a flat 3.0 credits per page, whether the page held one line or a dense table. Gen2 parsing on the Standard tier uses this formula where the characters returned make the price variable:
parse credits = (0.5 × pages) + (0.25 × (output_markdown_chars / 1,000))Every Gen2 Parse response shows the characters returned. Here is the metadata block from a real single-page parse job. Notice the output_markdown_chars, the service_tier, and the total_credits:
"metadata": {
  "job_id": "parse-01ky0wqr8gwsc1mmrba42h4s5g",
  "model_version": "dpt-3-pro-20260710",
  "page_count": 1,
  "output_markdown_chars": 1285,
  "range_units": "unicode_codepoints",
  "openapi_spec": "https://api.ade.landing.ai/openapi.json",
  "failed_pages": [],
  "duration_ms": 14329,
  "billing": {
    "service_tier": "standard",
    "total_credits": 0.9
  }
}
Extract pricing did not change. It still bills on the number of input and output characters, exactly as before (extract credit consumption). The formula for Standard tier service is:
extract credits = (extract_input_chars / 5,000) + (extract_output_chars / 1,000)The small extract reductions in the table (−3% to −14%) come entirely from the input side. Gen2 produces more succinct parse markdown (24% to 30% fewer characters across these corpora), and because parse markdown feeds extraction, fewer input characters means fewer credits charged.
Why the cost reductions vary across documents
Because Parse now tracks content, per-page cost stops being flat. The clearest view of cost per page for document extraction is the median in each corpus, split by step:
| Use case | Parse / page (Gen1 → Gen2) | Extract / page (Gen1 → Gen2) |
|---|---|---|
| Continuing education certificates | 3.00 → 0.80 | 0.61 → 0.60 |
| Food labels | 3.00 → 0.70 | 0.95 → 0.95 |
| Utility bills | 3.00 → 1.38 | 1.46 → 1.30 |
| Invoices | 3.00 → 1.00 | 1.80 → 1.60 |
Two things stand out. Gen1 parse is a flat 3.00 credits per page in every corpus, the median landing exactly on the rate, while Gen2 parse per page ranges from 0.70 on sparse food labels to 1.38 on dense utility bills, tracking what is on the page. Extract per page barely moves, confirming at the per-page level that the extract rate is unchanged; the small dips come from fewer input characters rather than a lower price.
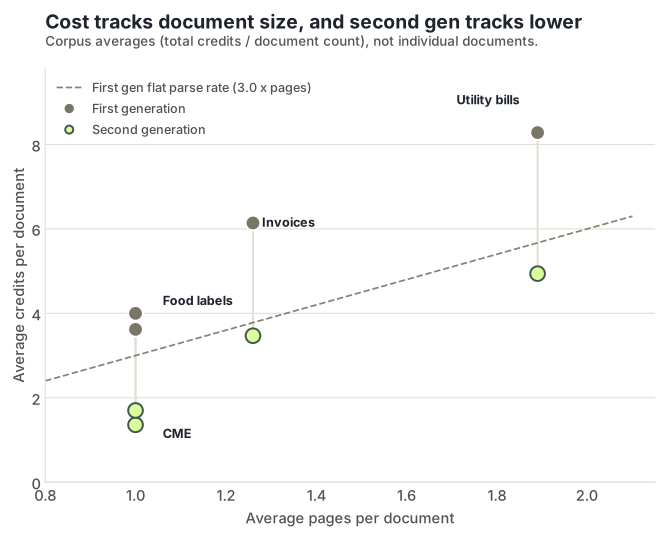
That is why a workload of sparse, single-page documents lands near the 62% end of the range, while dense, multi-page documents land closer to 40%. Model your own document extraction cost from your own mix.
The takeaway
On the same documents and schemas, Gen2 cost 45% fewer credits than Gen1, almost entirely because parsing costs are much lower. Extract pricing held steady and dipped only because it is fed fewer characters. Your savings scale inversely with document size and density, so estimate from your own mix. The formulas are simple and the metadata shows its work. Every benchmark is reproducible in the sample projects repo.
Want to read the credit line on your own documents? Try it at ade.landing.ai.