Extracting data from EKG reports
Every electrocardiograph prints its own report layout, with the machine's measurements and interpretation above a grid of twelve traces. Life insurance underwriters and clinical trial sponsors receive them by the thousand, as cardiograph PDF exports, faxed pages or scans in a medical records request.
Underwriting needs the heart rate, the PR, QRS and QTc intervals, and each coded interpretation statement. An underwriting rules engine compares the intervals with normal limits, and an abnormal statement routes the case to a medical director for rating.
What makes EKG reports hard
Settings printed on the tracing
Paper speed, gain and filter settings print on the tracing grid itself, in small type among the twelve leads and the rhythm strip.
Measurements printed with units
Rates and intervals print as strings such as 72 bpm or 160 ms, and a downstream rules engine needs each one as a number.
A layout for every cardiograph
Each cardiograph maker places measurements, axes and interpretation in its own header positions, under its own labels and abbreviations.
Parse, extract, verify
Parse
Parse turns the document into reading-order Markdown and a hierarchy of blocks (text, tables, figures), and grounds each block to its exact location on the page.
Extract
You define the fields in a JSON schema, and Extract returns their values in a consistent, structured format, each linked back to where it appears in the Markdown.
Verify
Each value links back to where it appears, down to the character range in the Markdown, and the page and bounding box in the source document, so every result can be verified.
One EKG report, end to end
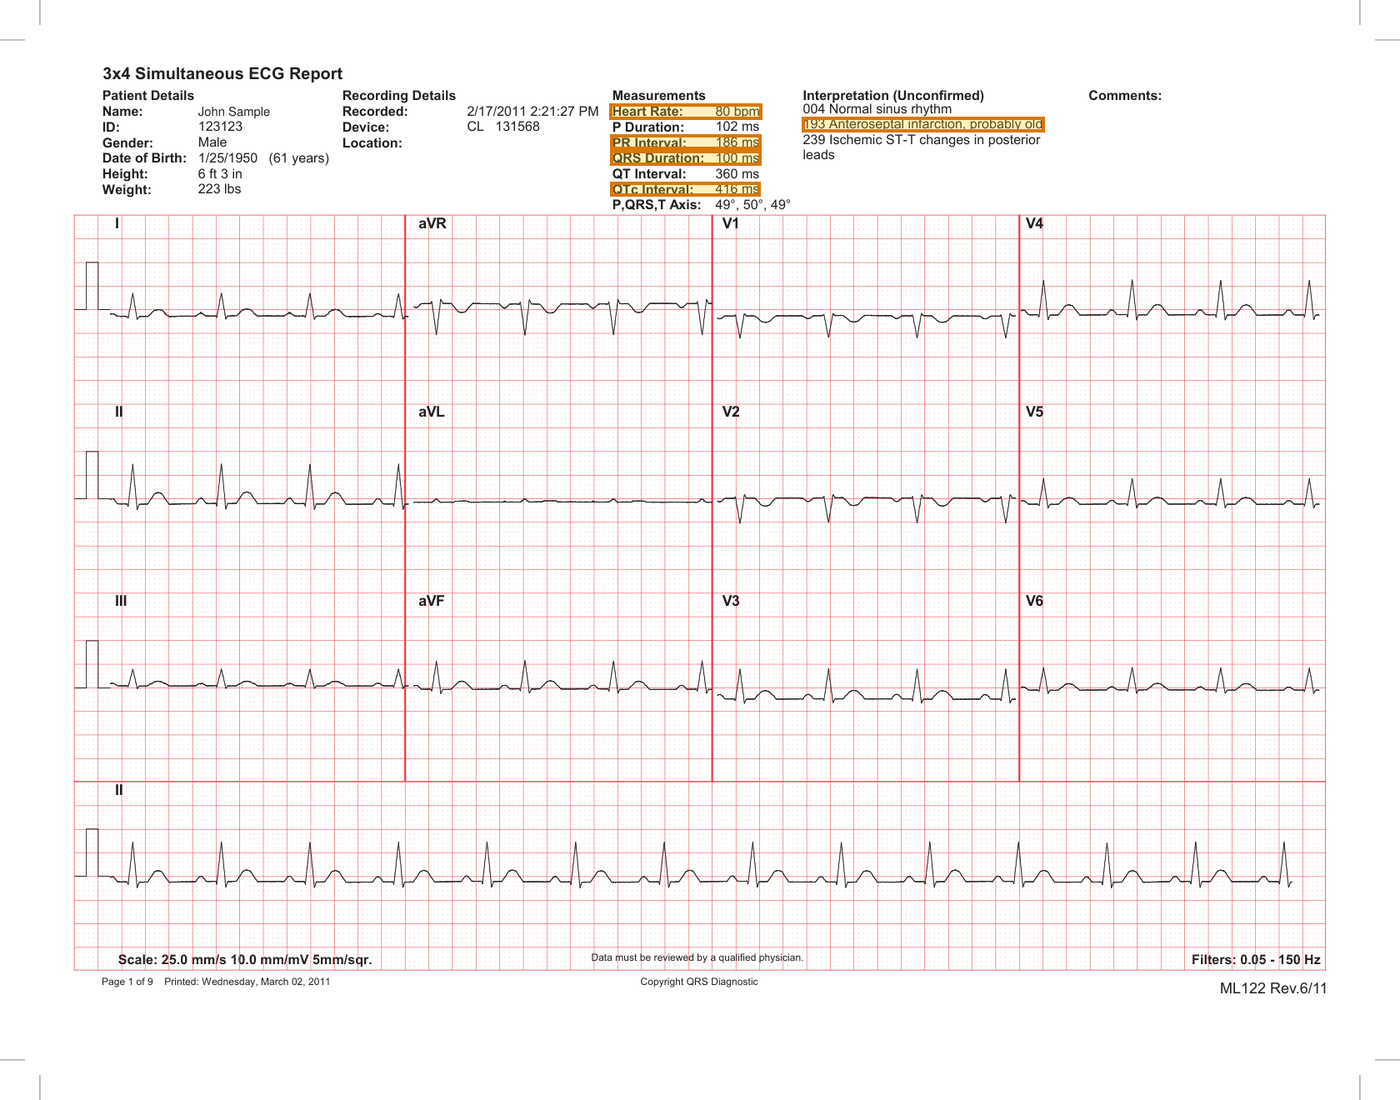
About this document: A resting 12-lead EKG report from VectraCor, published as the sample output of its PC-based Universal ECG system. One landscape page: the header carries patient details, recording details, measurements and interpretation statements, above twelve leads and a rhythm strip. Page 1 is featured. The patient's name was replaced with a stand-in. Eight pages repeating the same recording in other lead layouts were removed.
Processing objective: The objective is to read the machine's measurements and its finding as an underwriter would. The rate and three intervals print with their units and come back as plain integers. The statement is split from its numeric code, and each value grounds to its own header line.
Demonstration fields: Heart rate (bpm), PR interval (ms), QRS duration (ms), QTc interval (ms), Interpretation statement
The document
1 page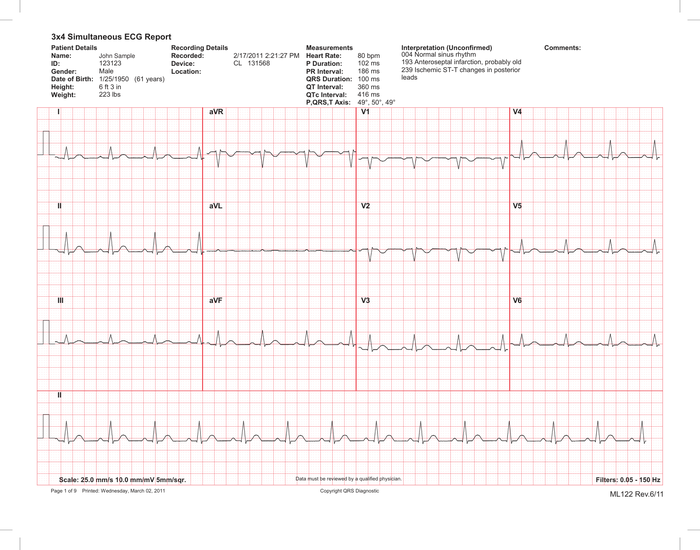 Page 1shown below
Where each value came from
measurements.heart_rate_bpm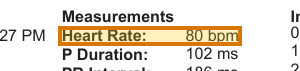
{
  "value": 80,
  "page": 1,
  "range": {
    "end": 274,
    "start": 255
  },
  "box": {
    "xmin": 0.43569,
    "ymin": 0.09444,
    "xmax": 0.54427,
    "ymax": 0.10848
  }
}measurements.pr_interval_ms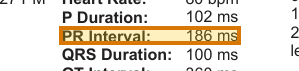
{
  "value": 186,
  "page": 1,
  "range": {
    "end": 315,
    "start": 295
  },
  "box": {
    "xmin": 0.43575,
    "ymin": 0.12272,
    "xmax": 0.54369,
    "ymax": 0.13612
  }
}measurements.qrs_duration_ms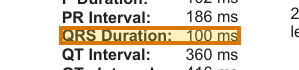
{
  "value": 100,
  "page": 1,
  "range": {
    "end": 337,
    "start": 316
  },
  "box": {
    "xmin": 0.43597,
    "ymin": 0.13683,
    "xmax": 0.5437,
    "ymax": 0.15043
  }
}measurements.qtc_interval_ms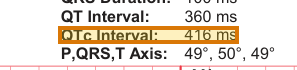
{
  "value": 416,
  "page": 1,
  "range": {
    "end": 380,
    "start": 359
  },
  "box": {
    "xmin": 0.4363,
    "ymin": 0.16572,
    "xmax": 0.54334,
    "ymax": 0.17874
  }
}interpretation.statements[1].text
{
  "value": "Anteroseptal infarction, probably old",
  "page": 1,
  "range": {
    "end": 507,
    "start": 465
  },
  "box": {
    "xmin": 0.57313,
    "ymin": 0.10648,
    "xmax": 0.74586,
    "ymax": 0.12011
  }
}
How to try it yourself
Everything on this page is reproducible. The sample, its schema, and the Parse and Extract API outputs are published. You can repeat the same two calls from whichever surface you already build on.
- Claude Skilldescribe the job; the agent writes it
- CLIno code at all
- MCPexpose ADE docs as an agent tool
- REST APIany language
- Pythonlandingai-ade
- TypeScriptlandingai-ade
Documents into data
Accurate
The best accuracy on the difficult documents other tools get wrong, such as messy scans, complicated tables, checkboxes and handwriting.
Auditable
Every answer cites its sources. Values come back with an audit trail (page, bounding box, character range) so a human can review them.
Agentic
Applies multi-step reasoning, and plans before it acts. Handles documents it has never seen before and adapts to variations.
API-first
Composable APIs that drop into any tech stack and can be called from anywhere. Easy to build on and embed in your pipelines and products.
Affordable
Cost-competitive rates with complete price transparency. Spend controls before you run, and every job reports its exact cost.
Enterprise-grade
Built for production and scale from day one. Fully observable and monitored, running securely in our cloud or yours.
Built for high-volume, high-throughput production
- Zero data retention
- Priority rate limits
- Enhanced support
- VPC and on-prem deployment
Available on Team and Enterprise plans. VPC and on-prem deployment require an Enterprise plan.