

When training a machine learning model, we mostly think about modifying the model architecture or model hyperparameters to improve performance. However, oftentimes we can actually get larger performance gains by modifying the data itself. Deep learning models are great pattern matchers but they tend not to generalize too much from the data you give it. For example, if you mislabel an image or if you do not have a particular pattern in your training data, this will confuse the model and cause incorrect predictions. This is especially true when you are dealing with smaller datasets as the errors make up a larger portion of the data.
To fix these issues you need to be very organized with how you analyze your data and also organized with how you address your errors. LandingLens offers several features to allow you to do exactly this. Tags, dataset snapshots, and model comparisons allow you to split your data in different ways either to evaluate or train on these splits. In this blog we will show you how to utilize these data-centric features to help improve your model performance.
For these examples we will be using satellite imagery and trying to segment roads, highlighted in purple.

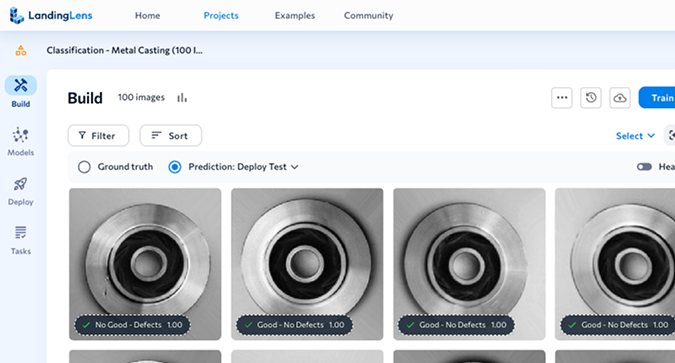
After we train a model in LandingLens we can see a new “Models” button over on the left side.

On the Models page, we can see the metrics on both the Train and Dev sets, which are micro-weighted Intersection over Union metrics (IoU).

We can see from the Train and Dev performance that our Dev performance is slightly low. You can click the percentage to see the Performance Report for this set and get more information.

From here we can see our IoU metric, our False Positive, False Negative and Correct (True Positive) predictions as well as our ground truth masks and prediction masks. To investigate the issue, let’s click the False Negatives since those are higher.

After clicking the False Negative, the images are sorted from highest false negative pixel count to lowest. The image on the left shows the ground truth minus the prediction label, or the error. If you hover over the image you will see the entire ground truth and prediction labels. If you click on the image, a new analysis page appears.

Here we see that the model is missing the parking lot. To solve this case first we need to find all the images with parking lots in our dataset. We can track these images by adding a new tag called “parking lot”

After we have tagged all of these images we can filter by the “parking lot” tag to find them all.

Here you can see that we have not labeled many of the parking lots in the dataset, which is why the model is missing them. We can now fix these labels (label all the parking lots) to solve the issue. We can also save all these images in a new snapshot by selecting them and then selecting Save snapshot.


We can give the snapshot a name and description. We can use this snapshot later to quickly test our model on this particular subset of data. For this example we only used one tag and three images, but as datasets become larger and more complex the tags become more useful for organizing data.
After relabeling and training the data we can see that our overall dev IoU improved by about 7%.

And our parking lot example is no longer at the top of the false negative list. Here’s a before:

And an after:

You can see the error region (ground truth minus prediction) has decreased indicating the model has improved it’s prediction on the parking lot area.
If we want to continue evaluating models on the parking lot data we can add an evaluation set on the dataset we created.

Then hover over the new column and click Evaluate. You can see a much more pronounced improvement on the parking lot set.

Here are the results from the first model:

And here are the results from the second (improved) model:

Conclusion
Tags can be used to slice your data in different ways and ensure your model is performing well on the parts of the data you care about. In the example below you can see we’ve added 3 evaluation sets in total for parking lots, railroads and cul-de-sacs.

I can then use these to find different strengths and weaknesses of the model and look for areas of improvement. Check out this new feature in LandingLens today!