Reading the slide, not just the text on it
Investor presentations put a company's numbers in their best light, and almost none of those numbers sit in a table. Quarterly earnings decks, pitch decks and analyst day presentations carry their substance in bar charts, pie charts, footnotes and dense mixed layouts. They run landscape, and every issuer designs their own.
A text layer gives you the axis labels in whatever order they were drawn. Reading the slide gives you the series, the categories, the footnoted adjustments, and how they relate. On a deck, that difference is the whole job.
What makes investor presentations hard
The numbers live in charts
A revenue figure may exist only as a labelled bar or a pie slice, with no row, no column and no table cell to anchor it. Treat the page as a stream of text and you either miss the number or scramble what it means.
Landscape, with several stories per slide
One slide will carry a headline, overview bullets, two or three charts and a block of footnotes. Working out what to read first is a layout problem before it is a text problem.
Footnotes change what the headline figure means
A one-off gain, a restatement or a change in accounting basis gets disclosed in six-point type at the bottom of the slide. Miss it and you misread the figure directly above it.
Parse, extract, verify
Parse
Parse turns the document into reading-order Markdown and a hierarchy of blocks (text, tables, figures), and grounds each block to its exact location on the page.
Extract
You define the fields in a JSON schema, and Extract returns their values in a consistent, structured format, each linked back to where it appears in the Markdown.
Verify
Each value links back to where it appears, down to the character range in the Markdown, and the page and bounding box in the source document, so every result can be verified.
One investor presentation, end to end
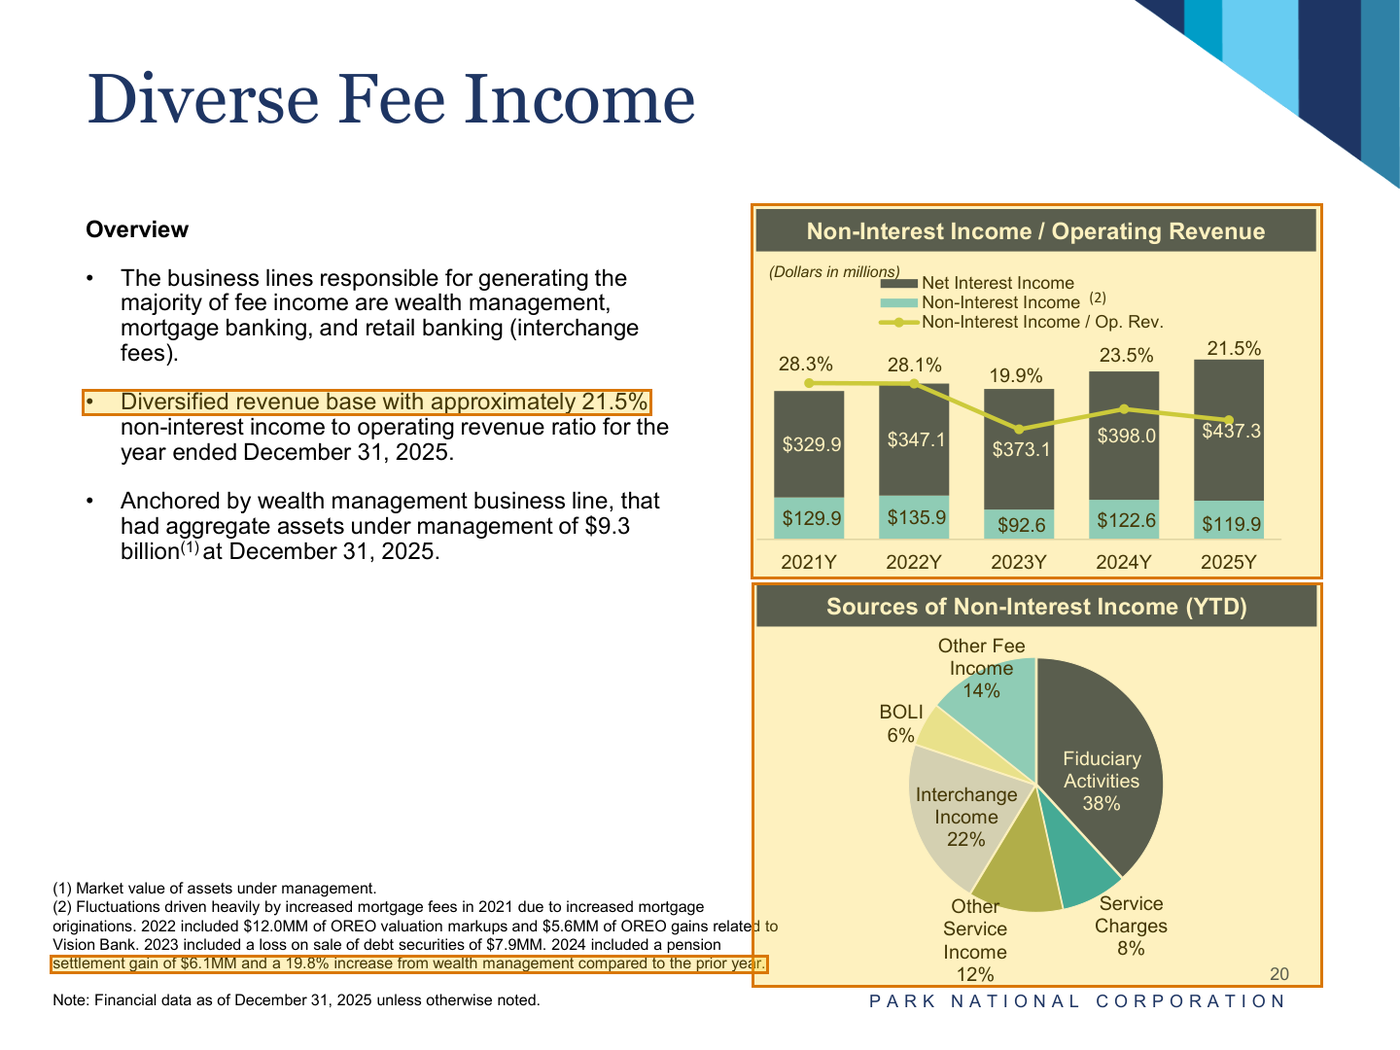
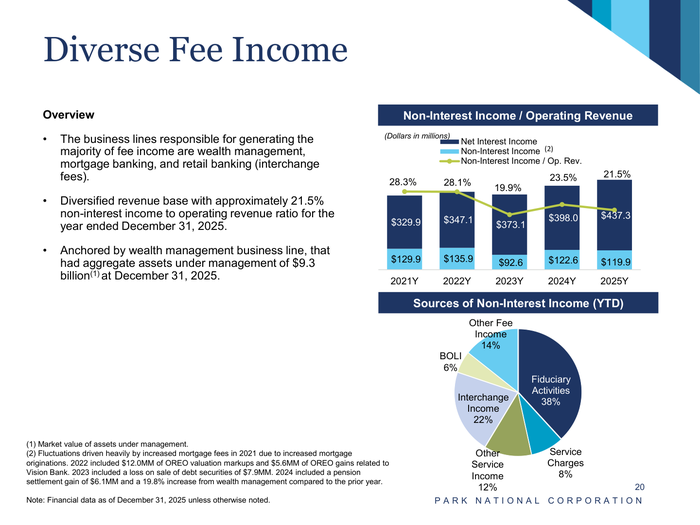
About this document: Park National Corporation's Q4 2025 investor slides, 43 landscape pages published for general distribution. Slide 20, "Diverse Fee Income", is the slide worth extracting from. It carries overview bullets, a stacked bar chart, a pie chart and a block of footnotes, and the figures that matter show up in all four.
Task overview: Pull the fee income story off slide 20: the non-interest income ratio stated in prose and again on a bar chart, the largest income source from a pie chart, and the one-off gain disclosed in a footnote. Four regions of one slide, and not a table among them.
Fields to extract: Non-interest income ratio (bullet), Non-interest income ratio (chart), Largest income source, Pension settlement gain — 4 of 23 fields in the schema, all on page 20.
The document
4 of 43 pages Page 1
 Page 15
 Page 20shown below
 Page 28
Where each value came from
Sample: Q4 2025 Investor Slides, Park National Corporation · Source
fee_income.non_interest_income_to_operating_revenue_ratio
{
  "value": "21.5%",
  "page": 20,
  "range": {
    "end": 46281,
    "start": 46230
  },
  "box": {
    "xmin": 0.05854,
    "ymin": 0.37082,
    "xmax": 0.46554,
    "ymax": 0.39617
  }
}fee_income.non_interest_income_to_operating_revenue_ratio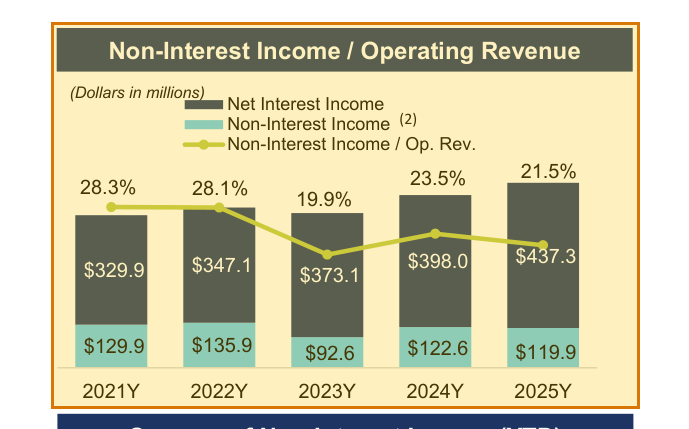
{
  "value": "21.5%",
  "page": 20,
  "range": {
    "end": 48094,
    "start": 48089
  },
  "box": {
    "xmin": 0.5362,
    "ymin": 0.19405,
    "xmax": 0.94471,
    "ymax": 0.55114
  }
}fee_income.income_sources[0].source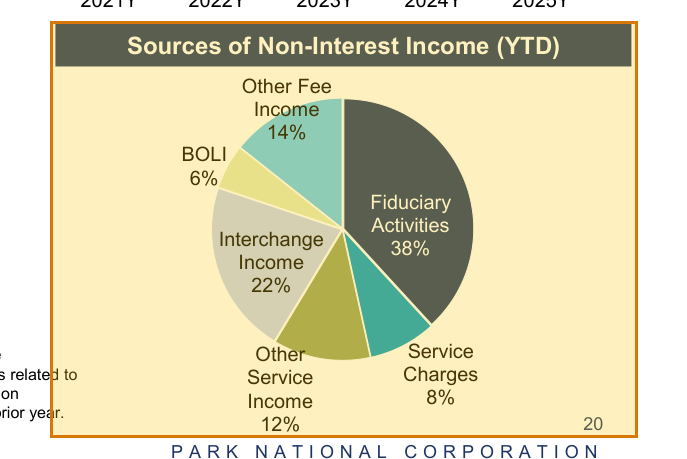
{
  "value": "Fiduciary Activities",
  "page": 20,
  "range": {
    "end": 48269,
    "start": 48249
  },
  "box": {
    "xmin": 0.53714,
    "ymin": 0.5555,
    "xmax": 0.94452,
    "ymax": 0.94042
  }
}fee_income.pension_settlement_gain
{
  "value": "$6.1MM",
  "page": 20,
  "range": {
    "end": 46940,
    "start": 46843
  },
  "box": {
    "xmin": 0.03598,
    "ymin": 0.90942,
    "xmax": 0.54876,
    "ymax": 0.92727
  }
}
How to try it yourself
Everything on this page is reproducible. The sample, its schema, and the Parse and Extract API outputs are published. You can repeat the same two calls from whichever surface you already build on.
- Claude Skilldescribe the job; the agent writes it
- CLIno code at all
- MCPexpose ADE docs as an agent tool
- REST APIany language
- Pythonlandingai-ade
- TypeScriptlandingai-ade
Documents into data
Accurate
The best accuracy on the difficult documents other tools get wrong, such as messy scans, complicated tables, checkboxes and handwriting.
Auditable
Every answer cites its sources. Values come back with an audit trail (page, bounding box, character range) so a human can review them.
Agentic
Applies multi-step reasoning, and plans before it acts. Handles documents it has never seen before and adapts to variations.
API-first
Composable APIs that drop into any tech stack and can be called from anywhere. Easy to build on and embed in your pipelines and products.
Affordable
Cost-competitive rates with complete price transparency. Spend controls before you run, and every job reports its exact cost.
Enterprise-grade
Built for production and scale from day one. Fully observable and monitored, running securely in our cloud or yours.
Built for high-volume, high-throughput production
- Zero data retention
- Priority rate limits
- Enhanced support
- VPC and on-prem deployment
Available on Team and Enterprise plans.